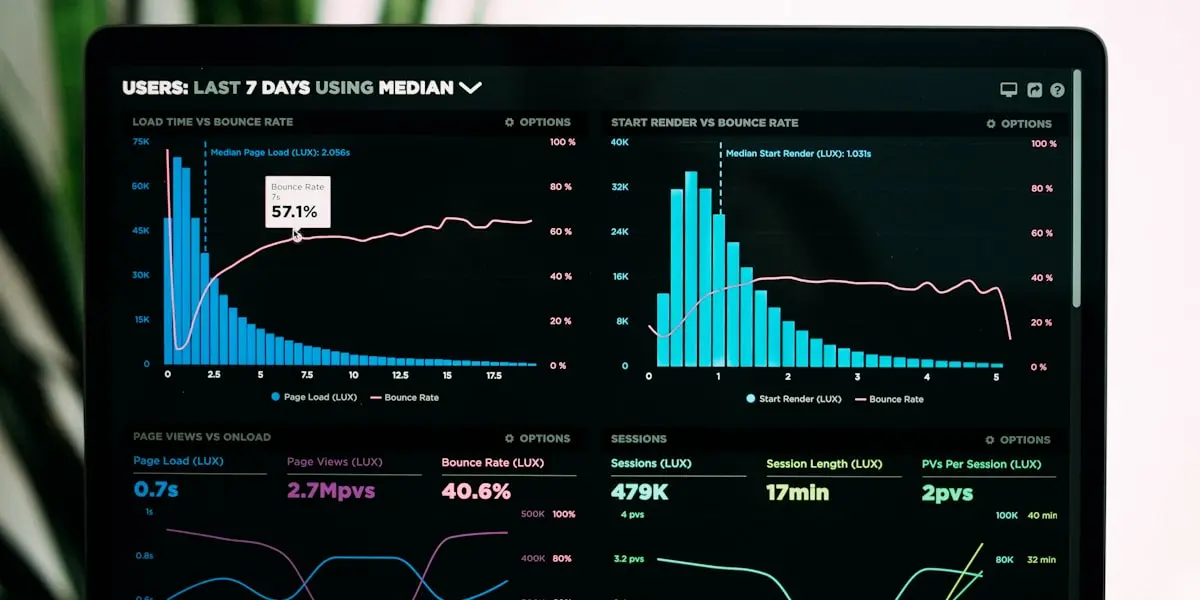
A global beverage group ran on outdated, manual reporting with fragmented data from various source systems. Sales reports were built in spreadsheets and were often outdated before reaching decision-makers. Different departments used different definitions for the same metrics, leading to contradictory reports. Mobile access w-existent — field teams and management had no insight on the go.
We consolidated the entire data landscape and delivered a next-generation, enterprise-wide analytics solution built on Power BI. A unified data model with clearly defined dimensions and measures replaces the previous siloed solutions. Automated reporting replaces manual processes, and mobile dashboards enable access from anywhere.
Consolidation of all relevant data sources into a unified data model. Rich, interactive Power BI dashboards for sales, marketing, and management. Mobile-optimized reports for field teams and executives. Automated reporting with scheduled refresh, fully replacing manual spreadsheet processes.
A single source of truth with accurate, real-time insight for decision-makers at all levels. Sales reports that previously took days are now available automatically and up-to-date — including on mobile. Contradictory metrics between departments are a thing of the past.
The key building blocks of this solution at a glance.
Data Consolidation
Merging all source systems into a unified, dimensionally modeled data warehouse.
Power BI Dashboards
Interactive dashboards for sales, marketing, and management with drill-down and filtering.
Mobile Reporting
Mobile-optimized reports with touch navigation for field teams and executives.
Automated Reporting
Scheduled data refresh and automatic report distribution to relevant stakeholders.
- Unified data model across all business units
- Interactive Power BI dashboards with drill-down capability
- Mobile access for field teams and management
- Complete replacement of manual spreadsheet reports